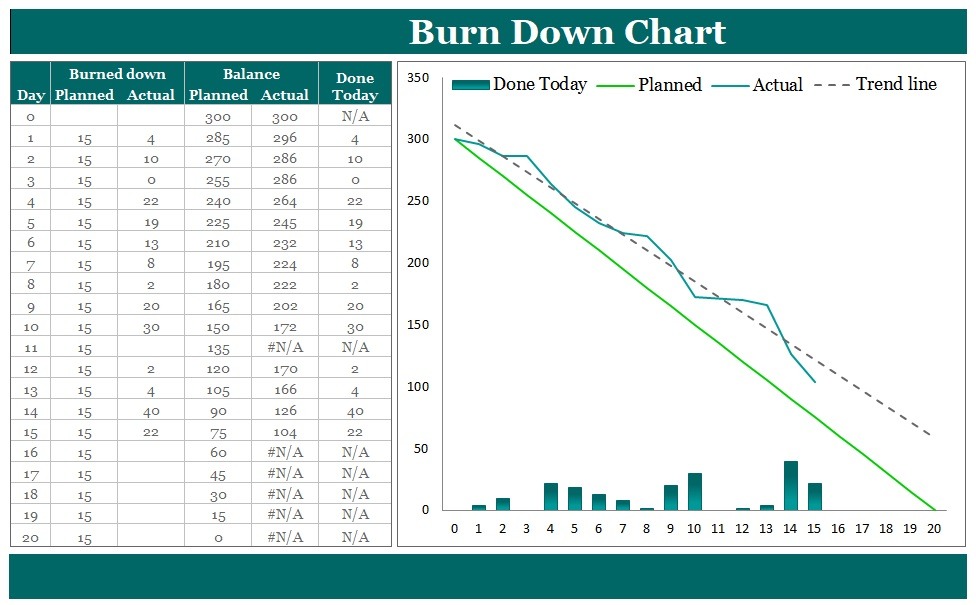
A burndown chart template provides a graphical display of the remaining amount of work that still needs to be done before the end of a project. Generally, these charts provide both project team members and the owner of the business with a common view of how work is progressing. This chart outlines the following information, such as; how much work has been done in each specific period, remaining work, work done so far, and when we can expect it to be done. These burning charts are great because they make the reality of the task clear, show the aspects of decisions, and remind you if things are not going according to plan. However, the burn down chart template will support the user to set the time unit with the representation of minutes, hours, weeks and days to know about the remaining period left for completion of the necessary task.
Benefits of Burndown Chart:
The benefits of using a burndown chart include the simplicity of understanding the chart. Basically, it gives a team their progress rate on a project. Moreover, they can determine how much work they have completed and how much is left. The burndown chart shows the positive side to a team and tells them how much has been successfully completed. In addition, these charts help them in identifying obstacles and difficulties in the course of the route and give an estimate of a successful solution. They also work as a team motivator, as seeing their progress can help a team to work more efficiently. Moving further, free burndown chart templates can be used to create a comprehensive yet elegant chart. The biggest benefit of using this chart is that it describes the whole project effortlessly.
Importance of Burndown Chart:
As far as the importance of the burn-down chart is concerned, no one can deny its role in project management as well as in the education sector. In order to meet the iteration goal, an individual should have to prepare a burndown chart in accordance with time. People often prepare this chart for measuring the progress of the tasks or projects, allotted by the employer or project manager, over a set period of time. Moreover, this scientific graph helps people to estimate the remaining work that is assigned either for a single task or a comprehensive project. This way, it guides employees and individuals to divide remaining work for early completion. Moving further, the professional burndown chart template is full of quality content and design. That is the reason why it enables users to take the fullest advantage of this format.
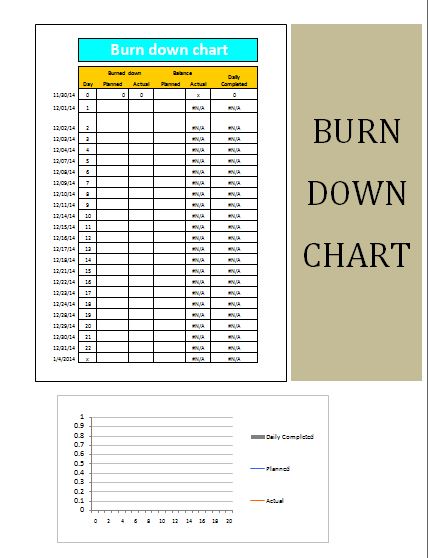
Templates for Burndown Chart:

 www.expertprogrammanagement.com