A pareto chart template is a type of chart which contains both bars and a line graph in which values are plotted in descending order by bars while the collective total is displayed by line. A chart is used to graphically summarize and show the relative importance of the differences between groups of data. It can be used to quickly recognize which business problem needs attention first and clearly shows which variables have the maximum cumulative effect on a given system. The pareto chart is one of the best essential tools for quality control. Moreover, it can be used in business for running procedures that are truly based on quality control.
Purpose of Pareto Chart:
The basic purpose of a pareto chart is to emphasize the most important elements that affect a variable. The simple graphical visualization makes this chart extremely easy to understand and an efficient tool to explain the scenario and its basic causes to the audience. Businesses which are facing big problems can use this chart, which is a very useful tool. It will help these businesses to focus on those areas which are causing problems. Moreover, they will need to apply resources in those areas where they are necessary. In addition, the pareto chart helps the user to identify the primary issues faced by businesses, along with highlight the efforts made by these businesses. By following the guidelines provided by this chart, a business can not only focus on avoiding the harmful impact on sales volume but also achieve the greatest improvement in the overall system.
Importance of a Pareto Chart:
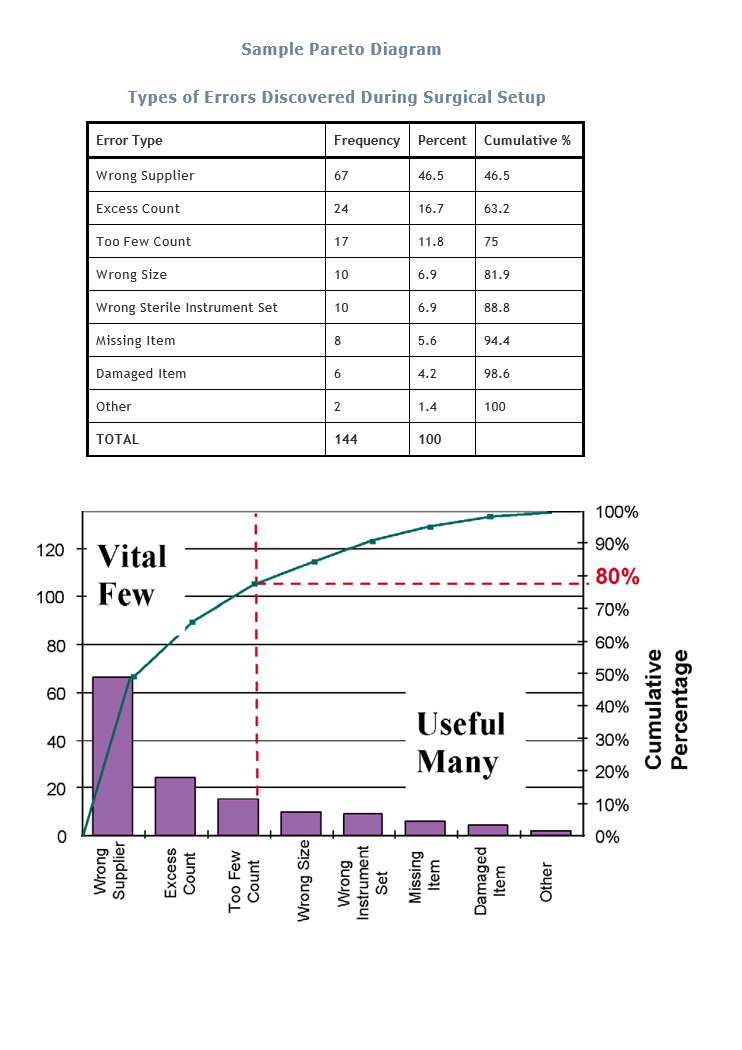
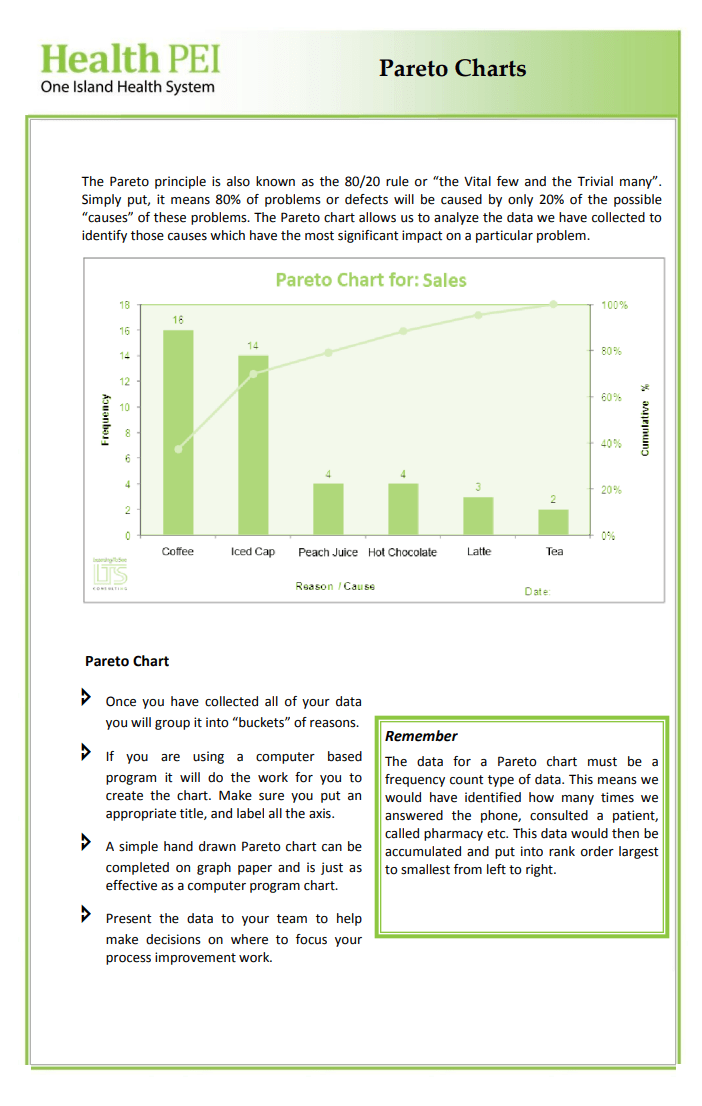
The Pareto chart holds amazing significance as it provides in-depth analysis with the help of graphs and images. It categorized the problems into the 80/20 segment, which is also defined as 80% of problems are caused from 20% of the real issue. Analyzing problems and highlighting solutions are the key characteristics of this chart. It basically identifies the relationship of inputs with outputs and then recommends the resolution of identified areas. Being a very economical yet effective tool, a pareto chart allows an organization to apply this method with full confidence.
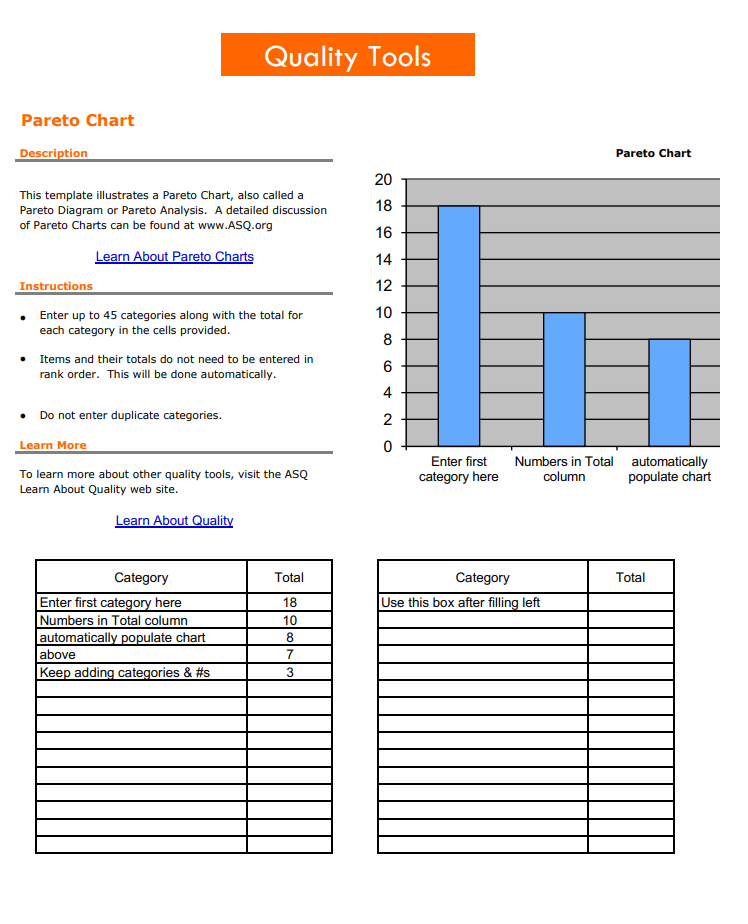
Templates for Pareto Chart: